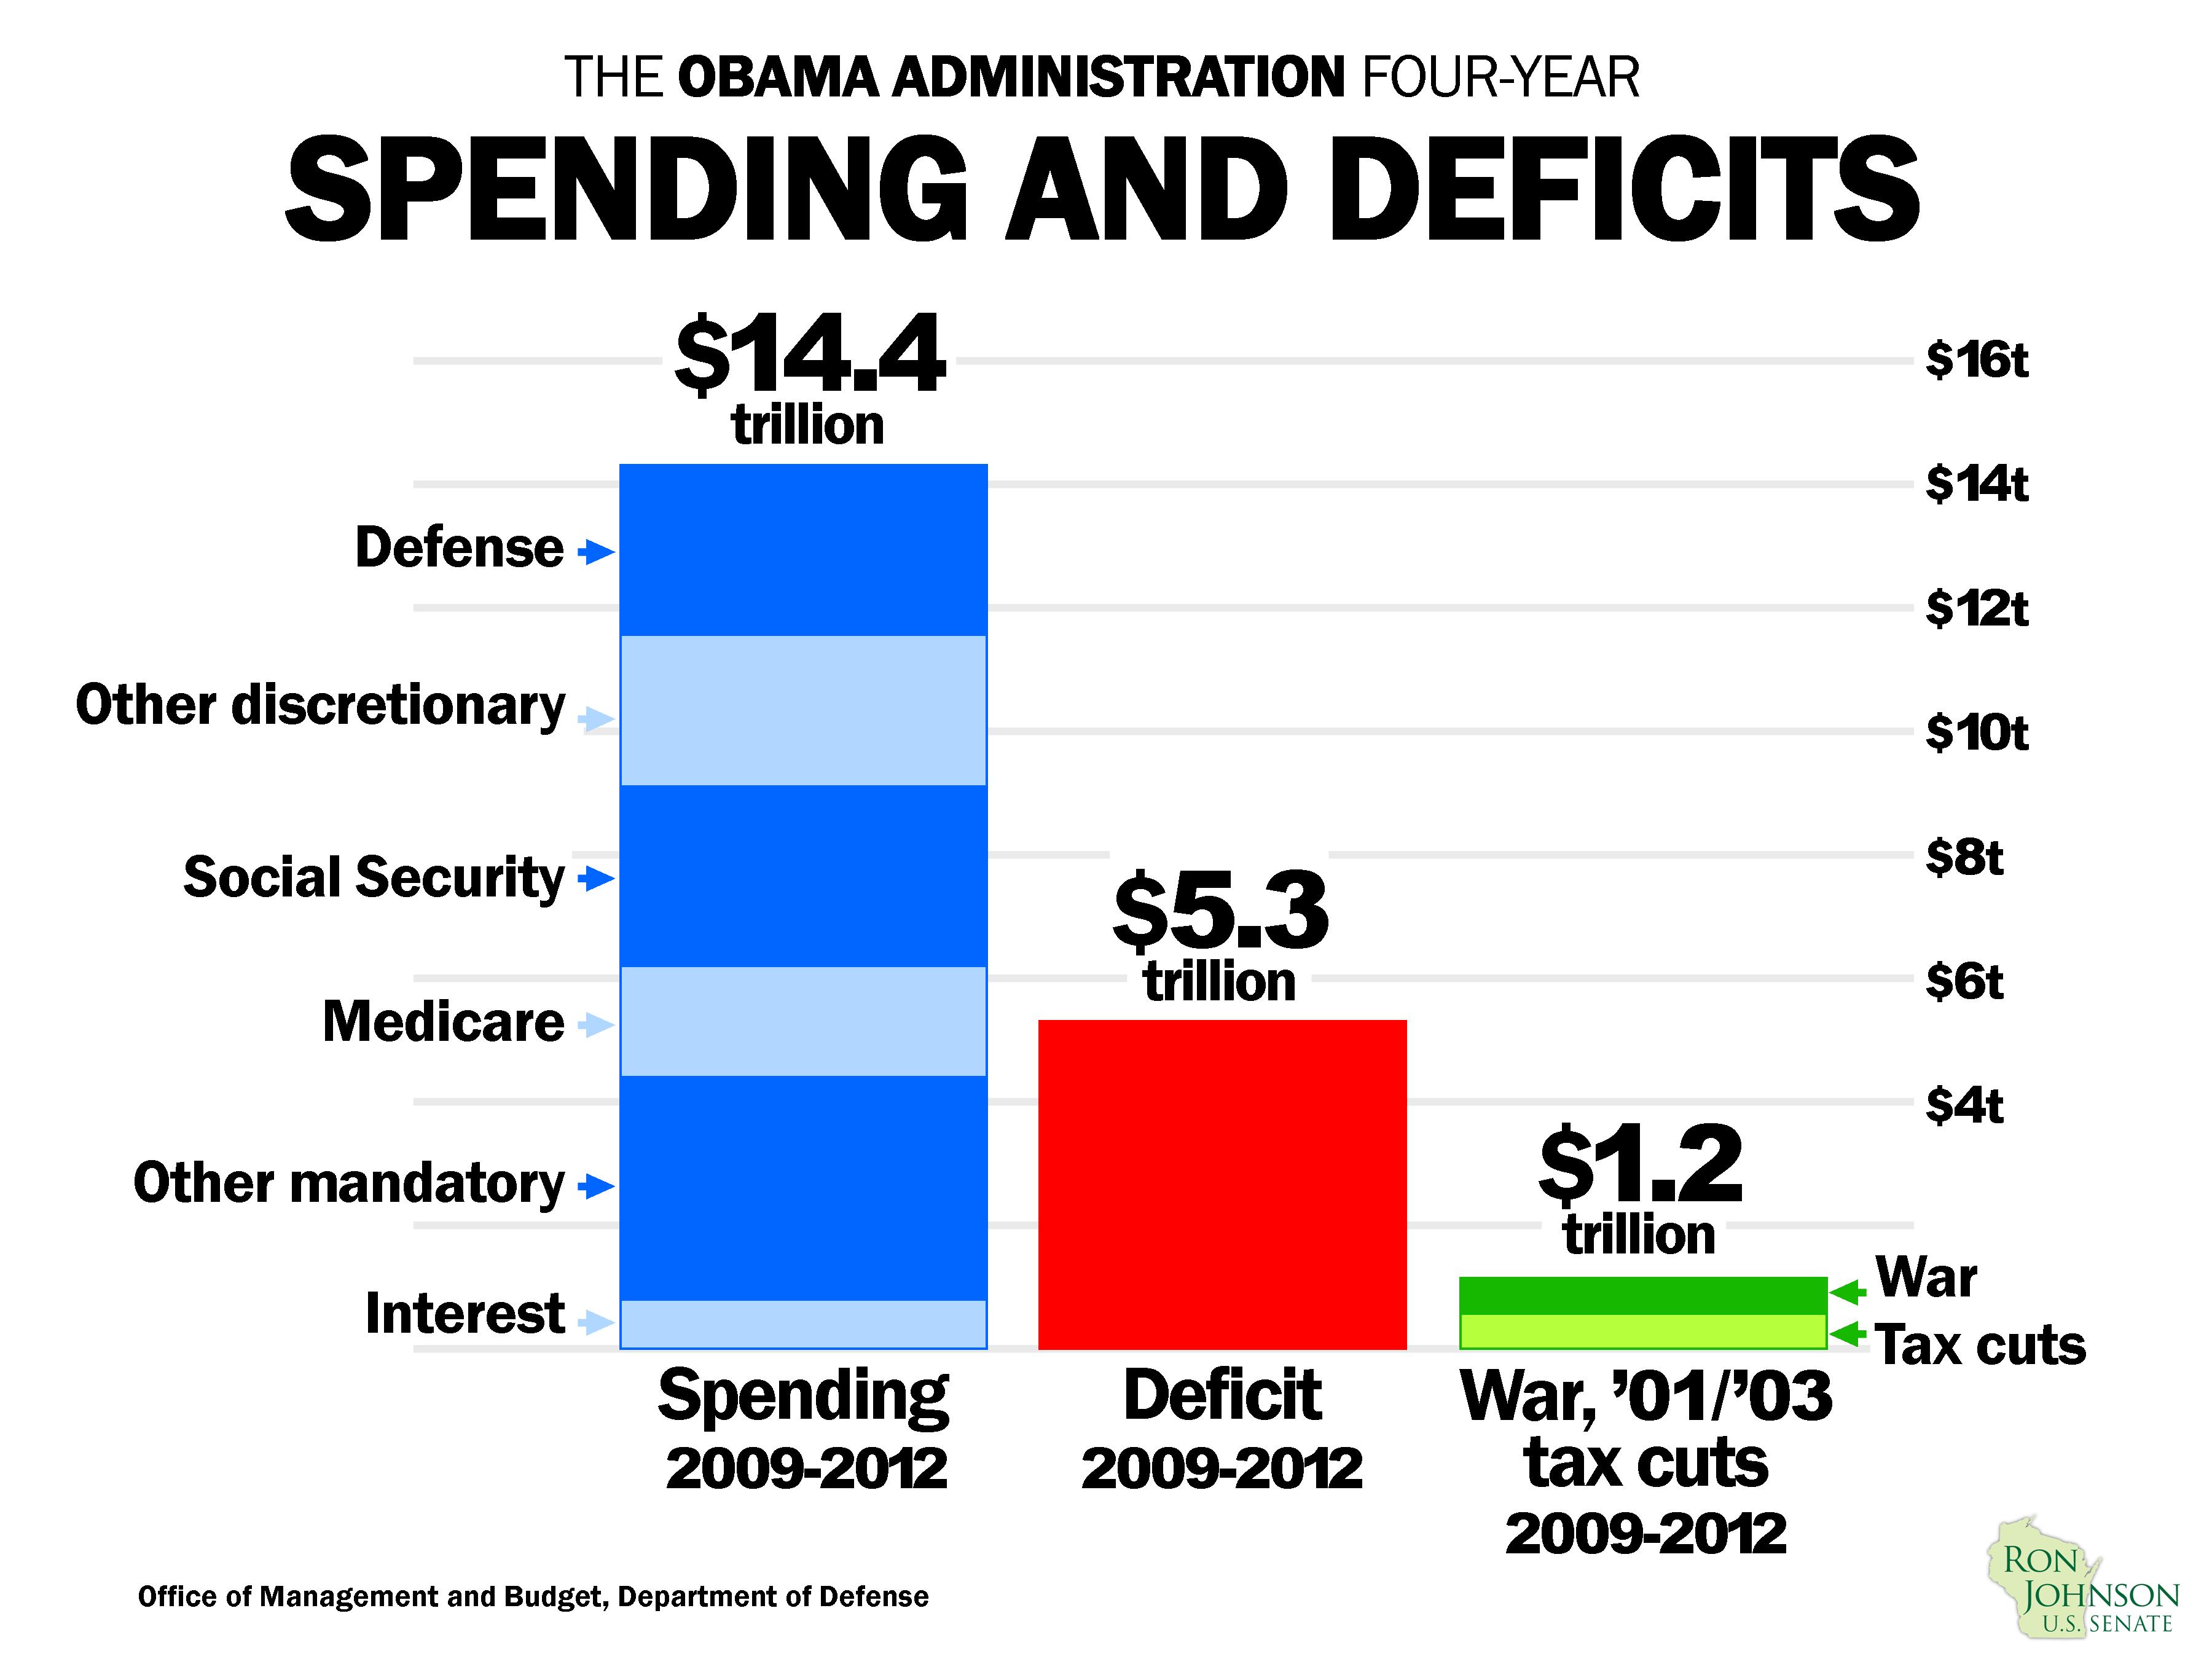
Oct 16, 2012 | Charts
Oct 16, 2012 | Charts
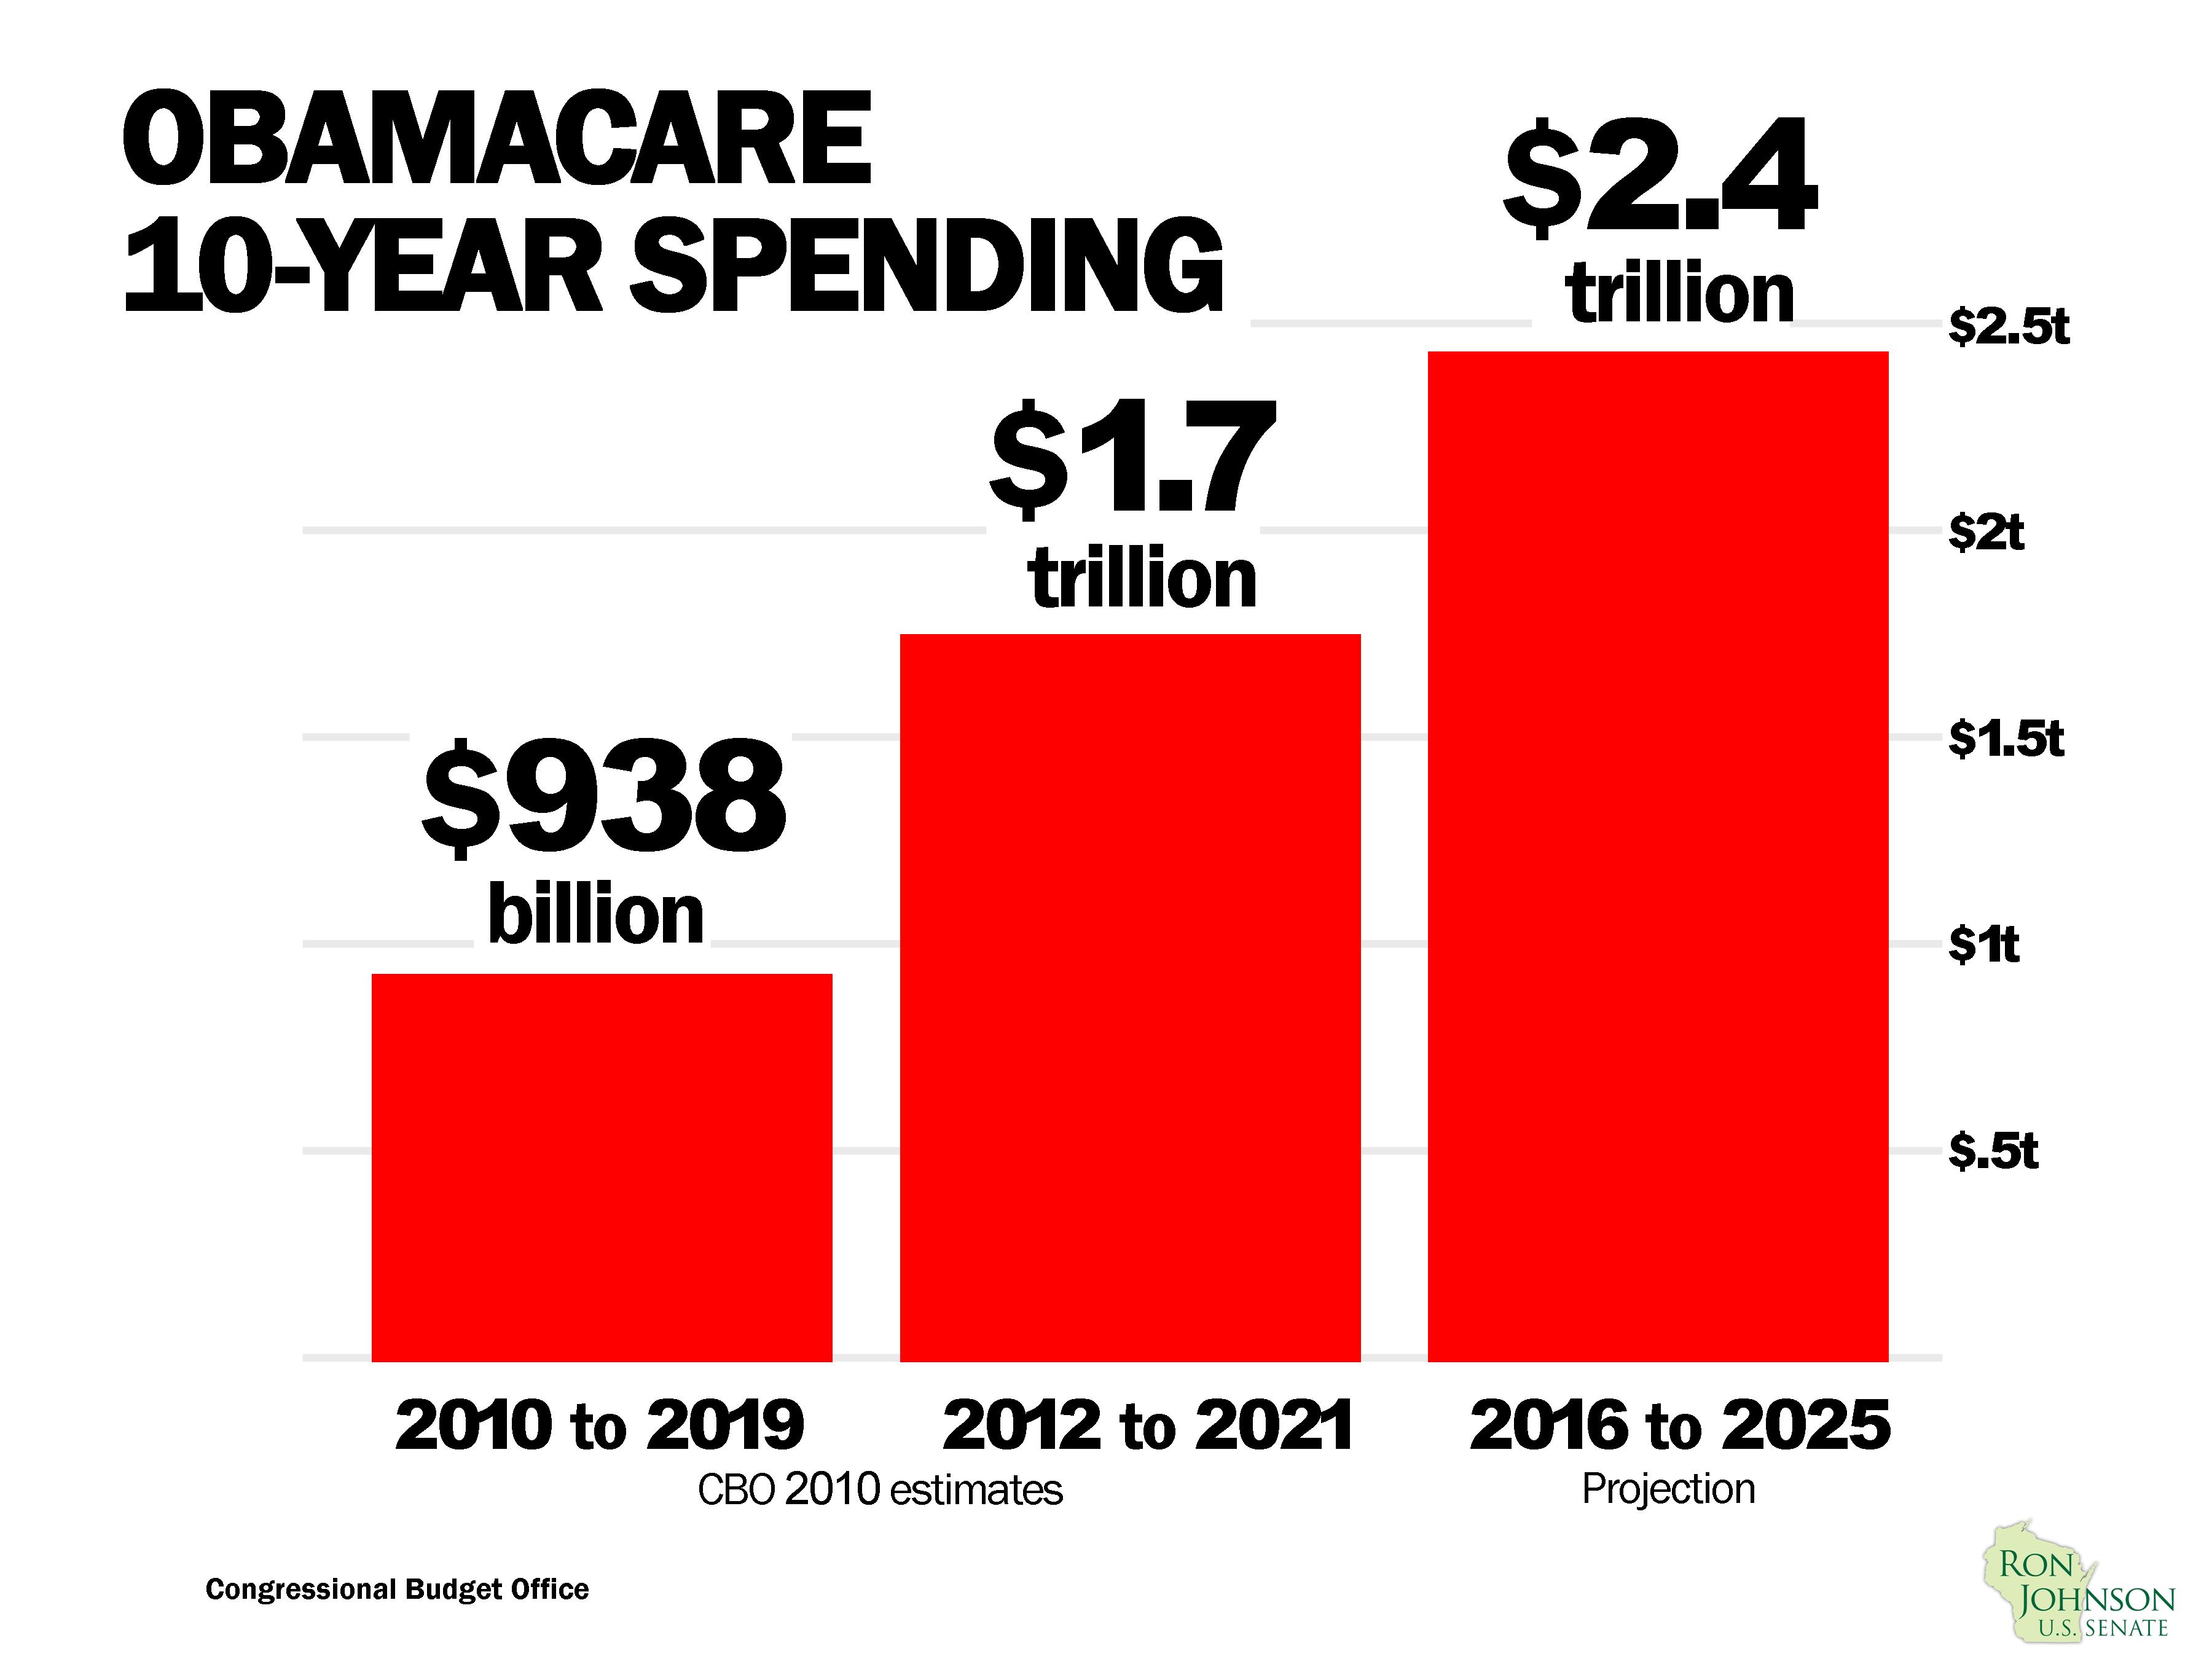
When the 2010 healthcare law was proposed, President Obama was concerned that it not cost more than $1 trillion. He also wanted to make sure that the Congressional Budget Office (CBO) not judge it as adding one dime to the deficit. So they implemented the law in a way...
Oct 16, 2012 | Charts
The data used in preparation of this chart can be viewed here.
Oct 16, 2012 | Charts
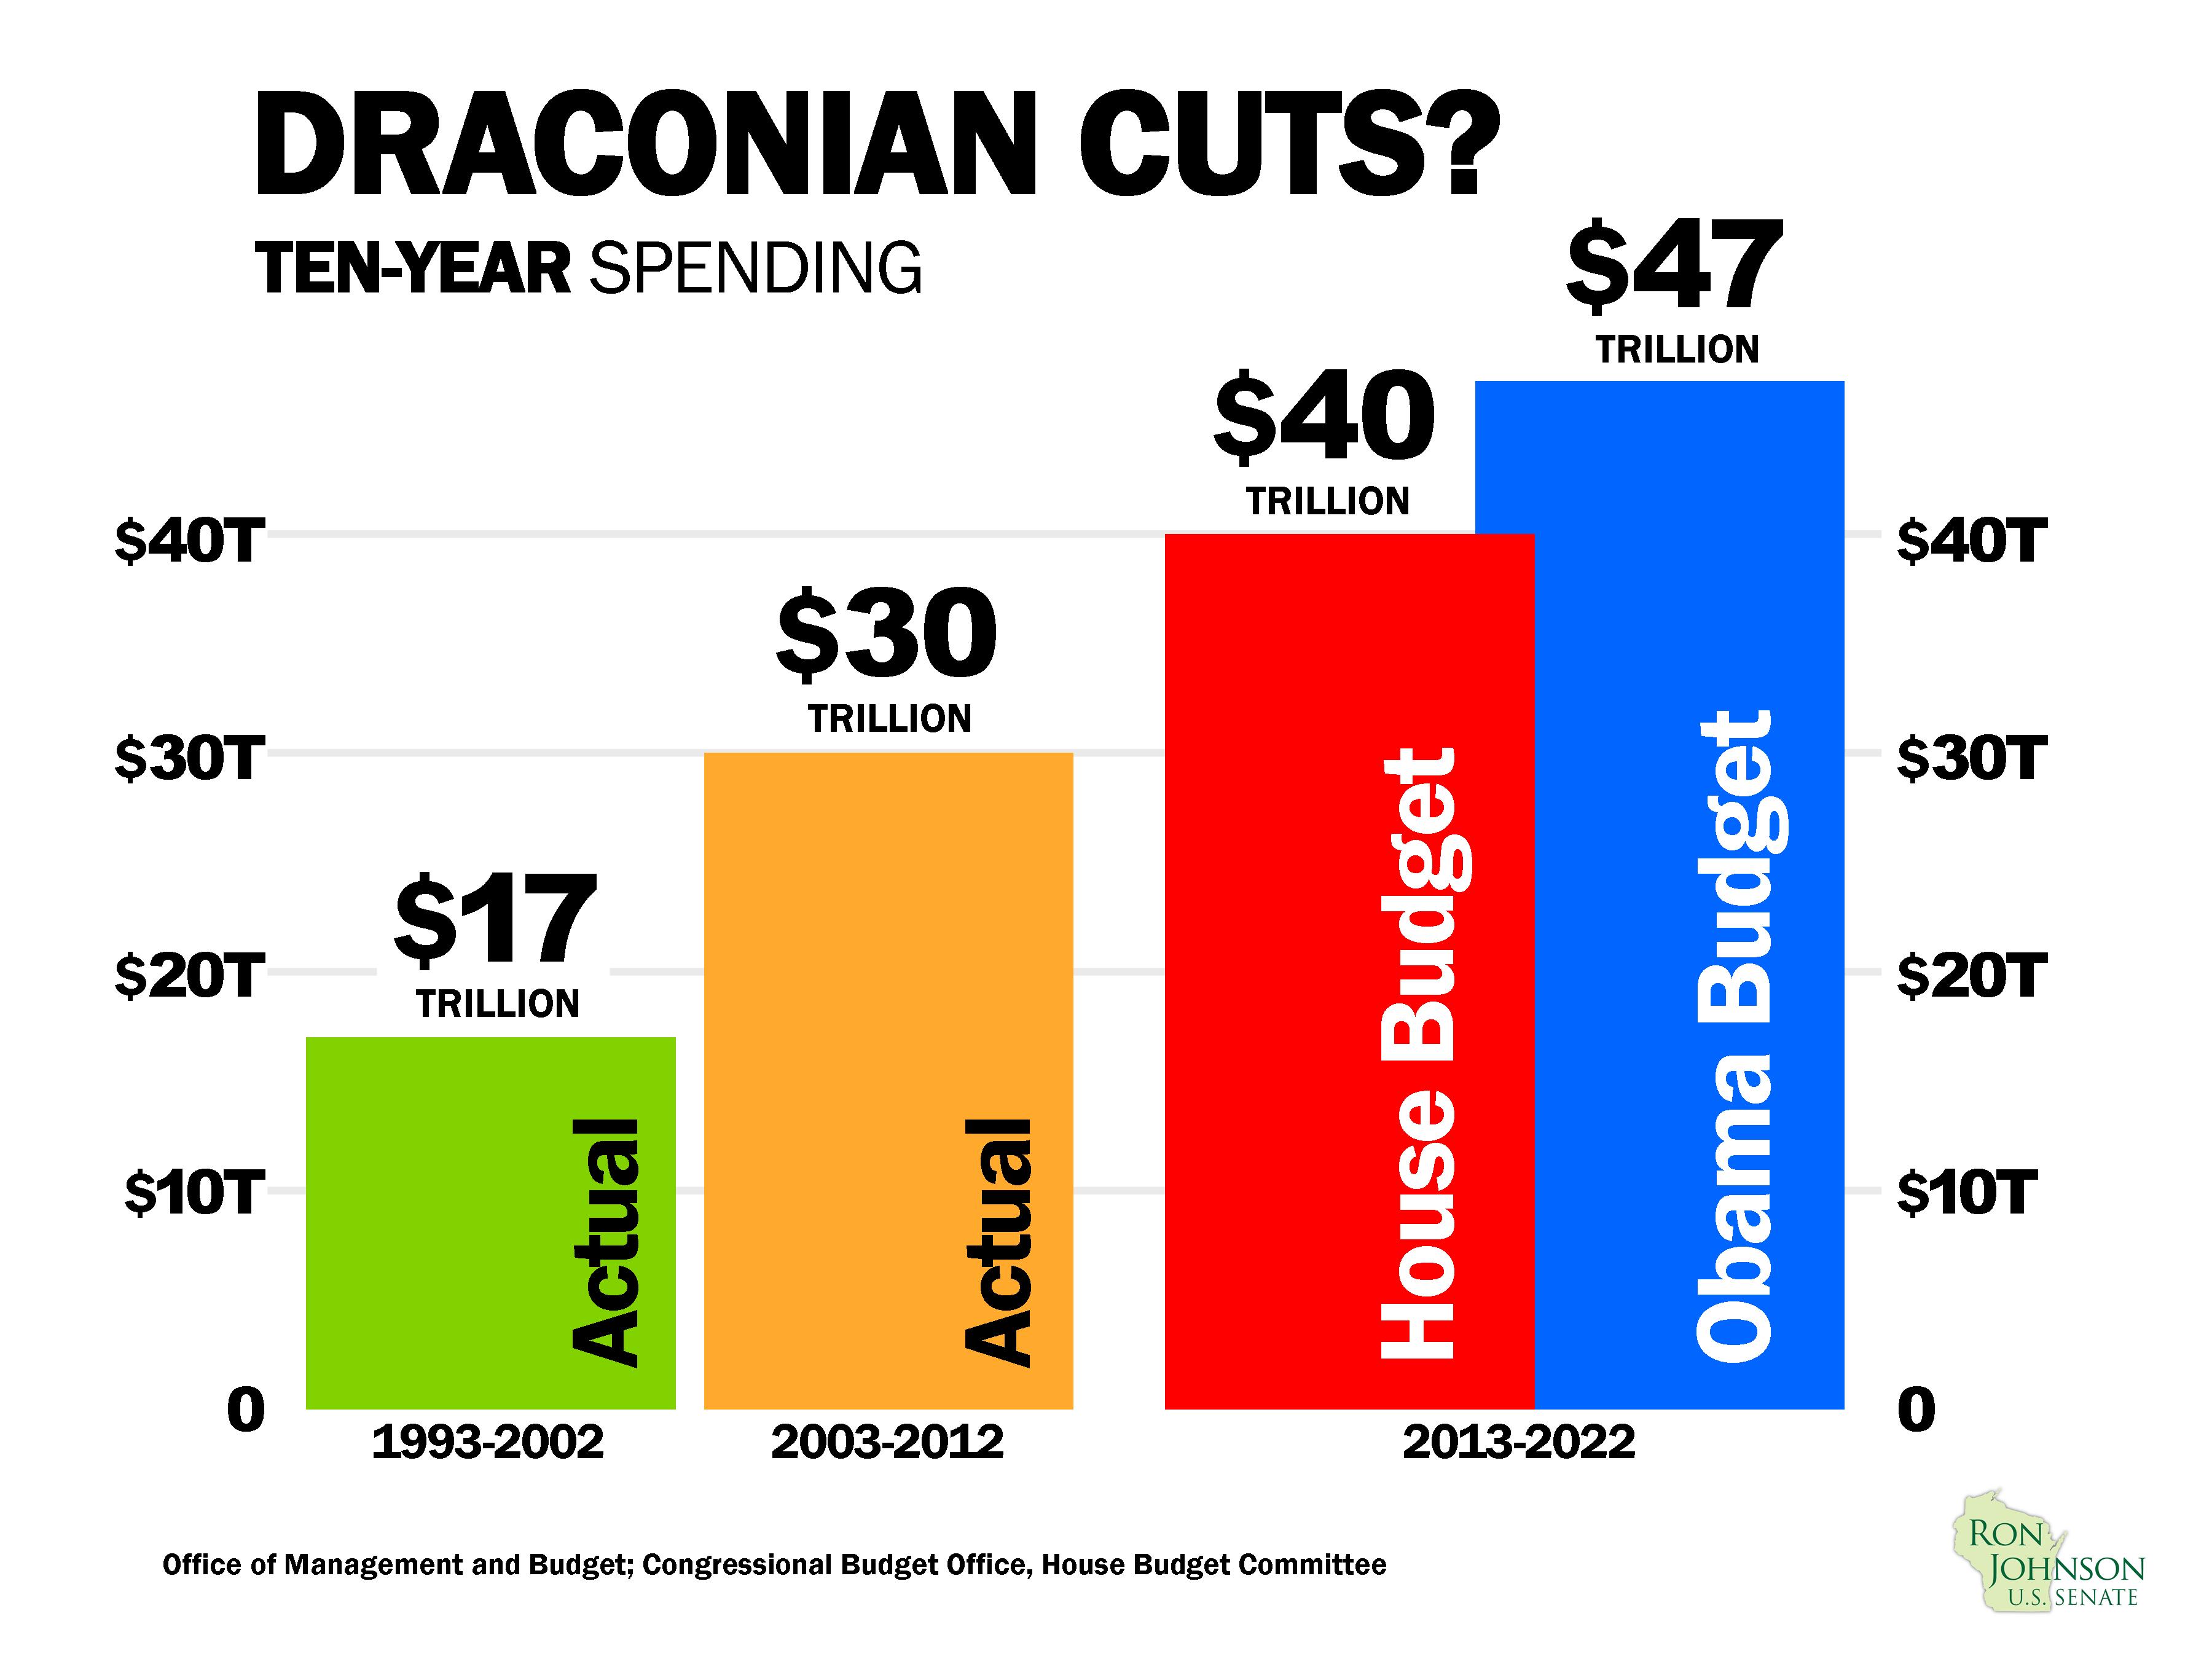
From 1993 to 2002 the federal government spent $17 trillion. During the past 10 years the federal government spent $30 trillion – almost doubling spending from decade to decade. The House budget proposes spending $40 trillion during the next 10 years. President...
Oct 16, 2012 | Charts
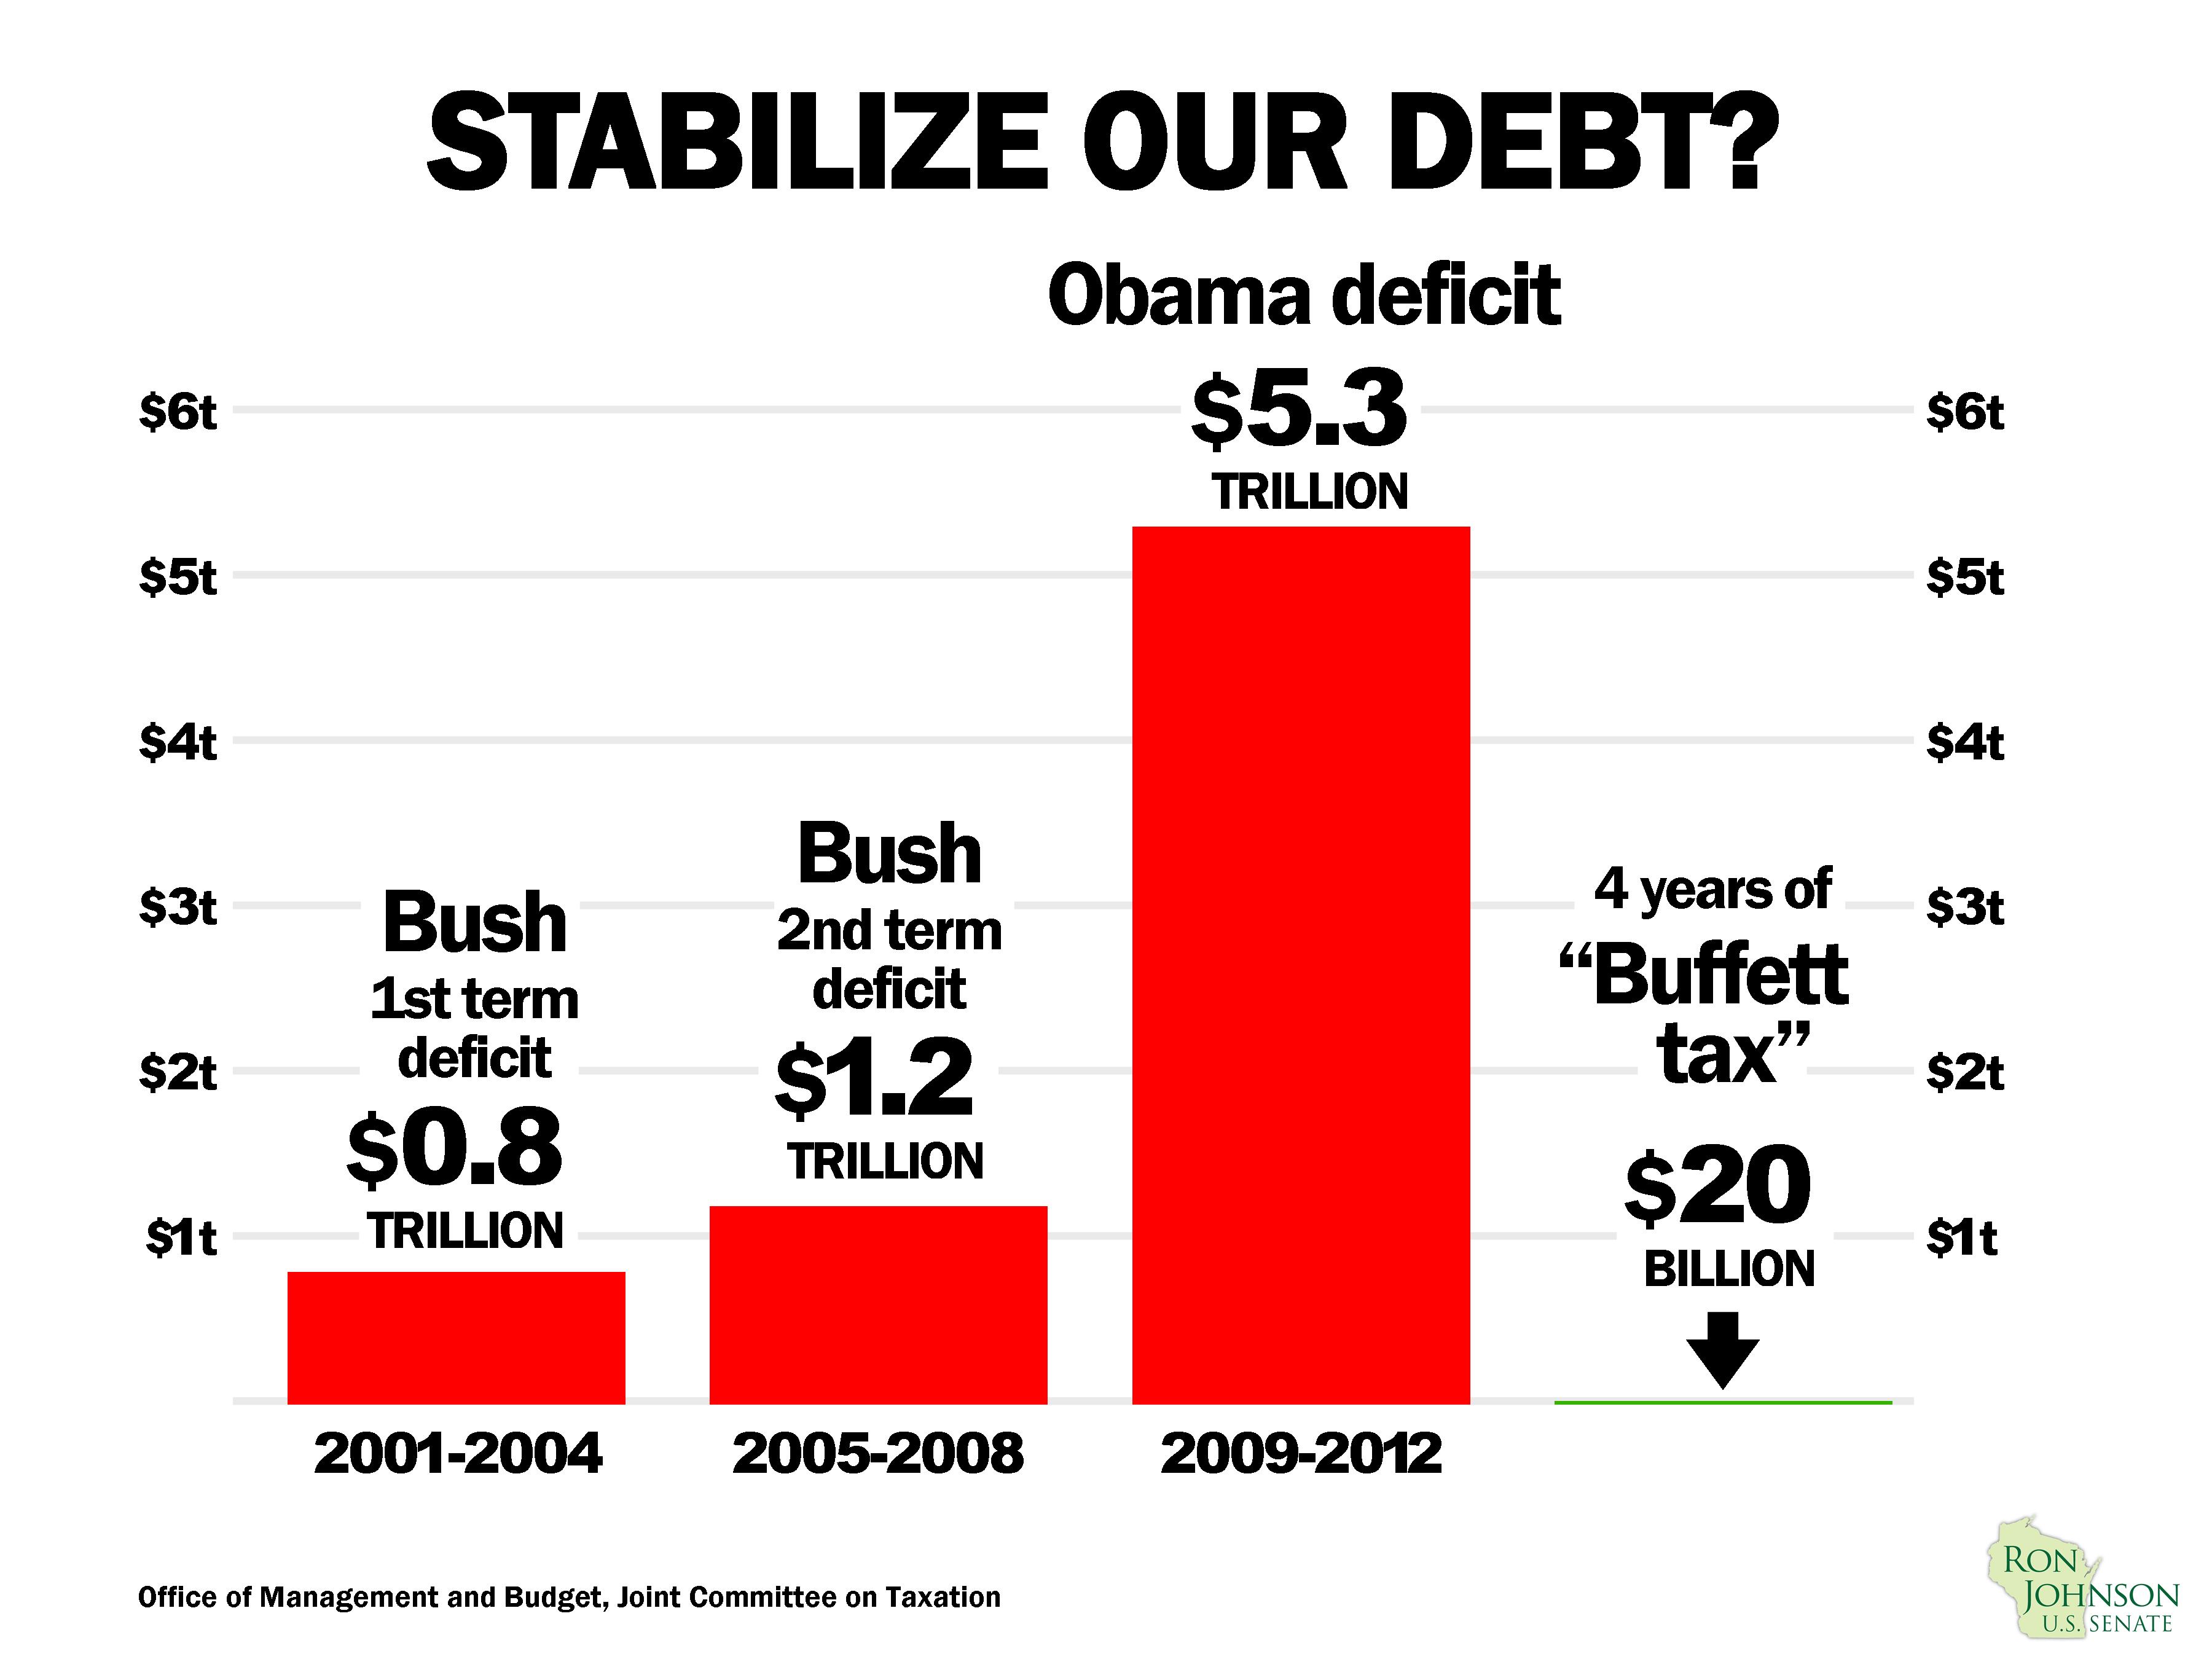
One of President Obama’s proposed solutions for the debt and deficit is something he calls the Buffett Rule, or Buffett tax. The President said that if you enact the principles of the Buffett rule, “not only do we pay for our jobs bill, but we also...